Since the founding of The Best Bees Company more than ten years ago, our beekeepers have collected more than 50,000 records on hives in 11 metropolitan areas across the country—making this the largest database on honeybee health in the nation, if not the world. These records, input into our proprietary software Bzzz, include a host of information on bee colonies, such as:
- Queen health
- Brood size
- Interior development
- Honey production
- HoneyDNA
- Invasive pest and pathogen presence
- Mortality rates
Best Bees collects the data and our sister non-profit research organization, the Urban Beekeeping Lab, analyzes the data.
We’ve already learned so much
Our analysts have dug deep into this database to vastly expand our knowledge of bee behavior, bee health, pollination sources, and the effectiveness of different pathogen treatments. Their findings have helped our beekeepers improve bee health and reduce the rate of colony loss.
One of the greatest assets of the database is its temporal and geographic specificity: UBL analysts can look at health indicators by season, by year, and over a number of years; they can look at data by individual hives, location type (urban, suburban rural), by metro area, and by region.
This has led to some very interesting findings, such as the remarkable health of urban hives, who have, perhaps surprisingly, access to a more diverse range of flowers than suburban hives, and the impact of microclimates in places like the Bay Area, where a dozen miles can mean the difference between drought conditions with few flowering plants, and lush areas that get ample rain, with a bounty of pollen and nectar.
What else could this data reveal?
As their knowledge of bee health has grown, our data analysts have come to ponder what breakthroughs could be gained if they could augment our own vast database with geographic-specific information about weather, environment, and land-usage. Could we:
- Learn how to optimize hive locations with pin-point accuracy?
- Recognize tipping points in habitat loss and move hives to more productive areas?
- Respond faster to adverse weather conditions?
We thought we might even be able to identify “Bee Blue Zones,” or specific places where honeybees will thrive, similar to human “Blue Zones” first identified by Dan Buettner and his research colleagues.
In their groundbreaking research, they used data to identify where humans live longer. If only there were a global source of such data—one that could match, precisely, the location of our hives…
Serendipitous connections do occur in the world!
While our analysts began to look for sources for such data, the NASA Develop program was conducting its own search for a partner who could help them use their global satellite data to evaluate the impact of environmental changes on agricultural production and food security.
Given the importance of bees on the world’s food supply, the NASA Develop project team saw honey bees as a key indicator, and so sought a large, comprehensive database of bee health to overlay on its satellite-based environmental data. Thankfully, it didn’t take long for them to find us.
In 2018, we conducted a project together to identify correlations between biophysical variables such as land-use change, vegetative cover & soil moisture, and honey bee health.
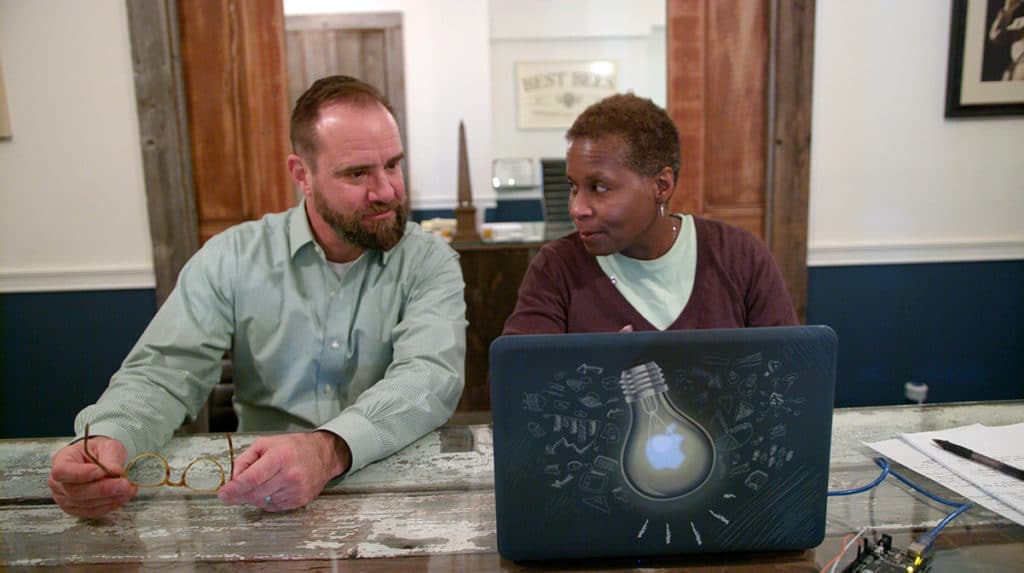
“As the lead data analyst for UBL at the time,” says Stephanie Davis, now a data operations manager at PTC, Inc., “I was assigned the responsibility of teasing our data into a usable format.” The database had to be adapted to the project’s needs. And as the source of the data was the 1,000+ hives of our clients, the dataset had to be scrubbed of all personally identifiable information to maintain client confidentiality.
This project, New England Agriculture and Food Security, led to the creation of an algorithm that can help us visualize patterns that are leading to further research.
If you want to know more about ways to visualize the correlation between satellite data, environmental factors, and bee health, watch our webinar where NASA Develop Fellow Darcy Grey and Best Bees Founder Dr. Noah Wilson-Rich presented findings on where pollinators thrive and why. Register Now.